The Effects of Dissolved Oxygen and Temperature on Fish Biodiversity
By: Alexander Graves, Maddox Prata, Colin Poirier, and Evan Sherman-Chan
Abstract
This lab report aims to determine the differences in fish biodiversity between two coral reefs in the Bahamas. Testing 4 factors: distance from shore, depth, temperature, and dissolved oxygen. It was hypothesized that higher levels of dissolved oxygen, distance from shore, depth, and temperature would correlate with greater fish biodiversity. Comparing the results of each indicates that “Something to See” had the highest biodiversity. Meaning that a greater distance from shore and depth, along with lower dissolved oxygen and temperature that are described, would have a higher biodiversity.
Introduction
Coral reef ecosystems are one of Earth's most diverse and abundant environments, which support thousands of marine species. These ecosystems are easily sensitive to physical and chemical changes in the environment. Changes such as temperature and dissolved oxygen (DO₂) levels can affect Coral reefs in multiple ways. These two factors are essential to marine organisms' survival, reproduction, and overall biodiversity, particularly in the microorganisms of fish. Fish are vertebrates with fins, gills, a lateral line, and scales. Each fish may have a different pattern, which allows you to distinguish each fish that includes spots, stripes, or bars. You can also use color and dorsal fin presence. Understanding how temperature and DO₂ influence reef biodiversity has become more urgent in the context of increasing ocean temperatures and pollution due to climate change and human activities.
Our study was conducted off the coast of Eleuthera, a long, narrow island in the Bahamas known for its coral reefs and closeness to the Atlantic Ocean. The Island School, in this unique setting, provides a hands-on learning environment through persevering water with navy showers, growing their food in a garden, and using fish poop to grow crops which all emphasize ecological research and sustainable living. Through our work, we explored two distinct reef sites, “4th Hole” and “Something to See,” which varied significantly in physical properties such as depth, distance from shore, temperature, and dissolved oxygen levels. For example, “4th hole” was by the shore, while “Something to See” was far out in the ocean. These differences allowed us to observe how these variables might shape the distribution and diversity of fish species.
Fish play a crucial role in coral reef ecosystems. They are important for the food web and help maintain coral health by controlling algae populations. Some of the fish observed during this study include yellowtail snappers, parrotfish, bluehead wrasses, juvenile damselfish, and the rare spotted drum. These species have different niches and tolerances for environmental stressors, making them useful indicators of reef health and water quality.
Our studies at the Island School taught us how abiotic factors such as salinity, pH, temperature, and dissolved oxygen interact with biological factors to influence biodiversity. From what we learnt in school about basic ecology and energy flow in ecosystems, and cellular respiration and its dependency on oxygen. We know from biology that oxygen is crucial for aerobic respiration, a process in which mitochondria convert glucose into energy (ATP) to fuel cell activity. Without sufficient DO₂ in the water, fish and other aquatic organisms struggle to survive, reproduce, and compete, ultimately decreasing biodiversity.
Research by the U.S. Environmental Protection Agency (2024) has shown that low dissolved oxygen levels can cause stress, behavioral changes, and even mortality in aquatic life. Additionally, temperature plays a vital role by influencing enzyme activity, respiration rate, and metabolic function. Warmer waters generally hold less dissolved oxygen, creating a double threat to aquatic biodiversity. However, while it is known that both DO₂ and temperature affect marine organisms, fewer studies have focused on their combined influence in coral reef ecosystems, especially in field-based contexts like the Bahamas. Most studies have been conducted in freshwater systems or under lab conditions, limiting our understanding of these relationships in natural marine environments.
This knowledge gap makes our research particularly important. By comparing biodiversity data from two coral reef sites with differing levels of temperature and DO₂, our study seeks to provide insight into how these variables interact to affect fish biodiversity in situ. Our findings can help inform reef conservation strategies and provide a foundation for future studies in marine ecology.
In this experiment, we investigate the relationship between dissolved oxygen levels (measured in mg/L), temperature, distance from shore, and depth, and fish biodiversity (measured by species richness and abundance) in coral reef ecosystems. We hypothesize that if there are higher levels of dissolved oxygen, further from shore, depth, and temperature will correlate with greater fish biodiversity. Dissolved oxygen is critical for aerobic respiration, the process by which fish and other aerobic organisms convert glucose into ATP (energy) using oxygen. Without sufficient DO₂, fish experience cellular stress, decreased energy production, and reduced ability to move, hunt, reproduce, and avoid predators, all of which lower their survival rates. In addition, we learned at the Island School that oxygen solubility in water is influenced by temperature and water movement. Because of this, reefs with cooler temperatures and higher circulation tend to have higher DO₂ levels, creating more hospitable environments for diverse species. Therefore, we expect that reef sites with higher dissolved oxygen will support more species and individuals than sites with lower DO₂ levels.
Methods
In this experiment, we were selected to research Fish in Eleuthera, Bahamas. On the evening of May 5th, 2025, before the experiment, we learnt about the different ways to classify a fish by looking at its colors and patterns. We also looked at the sample methods paragraph that we had written before going on the trip. We had four people, and assigned each a role. One person was the group leader, two were researchers, and the fourth was the resource manager.
The following morning, on May 6th, we went to a coral reef called “4th hole.” When we got there, we laid out the supplies, went over the ground rules, and started collecting data. The supplies consisted of data collecting materials, water-resistant notepads for each member, first-aid, and other useful materials, like a measuring tape. The first thing we did was send two people into the water to collect data. They took videos of the site to see how many fish are present, to calculate the amount of biodiversity for later. On shore, we first filled a cup of water, and measured the pH, Salinity in ppt, NO³, NO², temperature, and Dissolved Oxygen (DO) with its corresponding kit. To measure pH, salinity, NO², and NO³, we dipped a strip that had different squares on it into a cup of water from the beach. We then took it out, making sure no water dripped off, and waited a minute. After a minute, we looked at the bottle and compared the strip to which pH/Salinity level it corresponded with. With temperature, we stuck a thermometer into the ocean, and then, following this, with our water-resistant notepads, we wrote it down for later. For dissolved oxygen, we filled up a glass tube with sample water from the site, and then we used a dissolved oxygen (DO) kit, which changes color based on the DO₂ content. Then, using a thermometer, we measured the temperature of the water in Celsius.
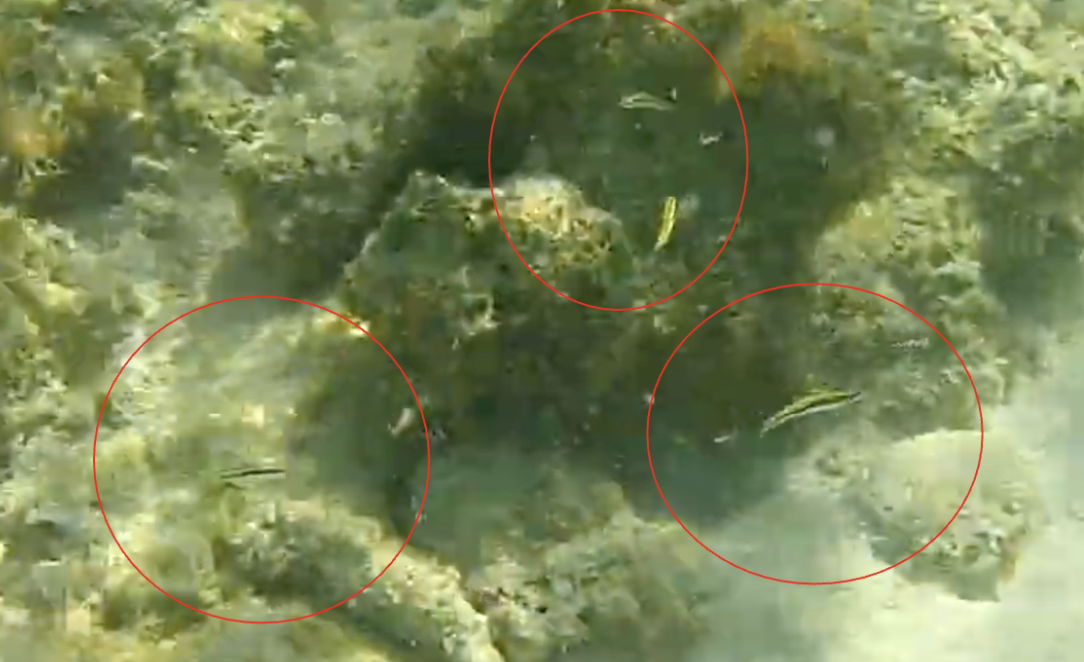
In the water, we first measured the depth using a secchi disc and temperature with a thermometer. We wrote it down on our waterproof notepad, which allowed us to write notes down in the water, for later reference. After this, we swam around filming, looking for different fish. After collecting our data, we swam freely around the coral reef.
The following afternoon, we went to the coral reef called “Something to see.” This coral reef, instead of being on shore, was in the middle of the ocean. So we took a 15-20 minute boat ride out there. Once there, we filled up a small bottle with water to test the water quality. Then we jumped in to record the temperature with a thermometer and depth with a secchi disc and recorded it on our waterproof notepad. After that, we were taking videos of fish around the coral reef.
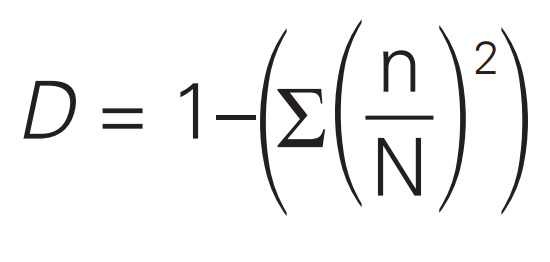
Once back in New York, we used Google Earth to find the distance from each location to shore. We also reviewed the video footage, taking photos and recording the different species of fish. Afterward, we used the Simpsons Biodiversity equation to calculate the biodiversity of each site.
Equation 1: Simpson's Biodiversity equation: Formula used to calculate Biodiversity.
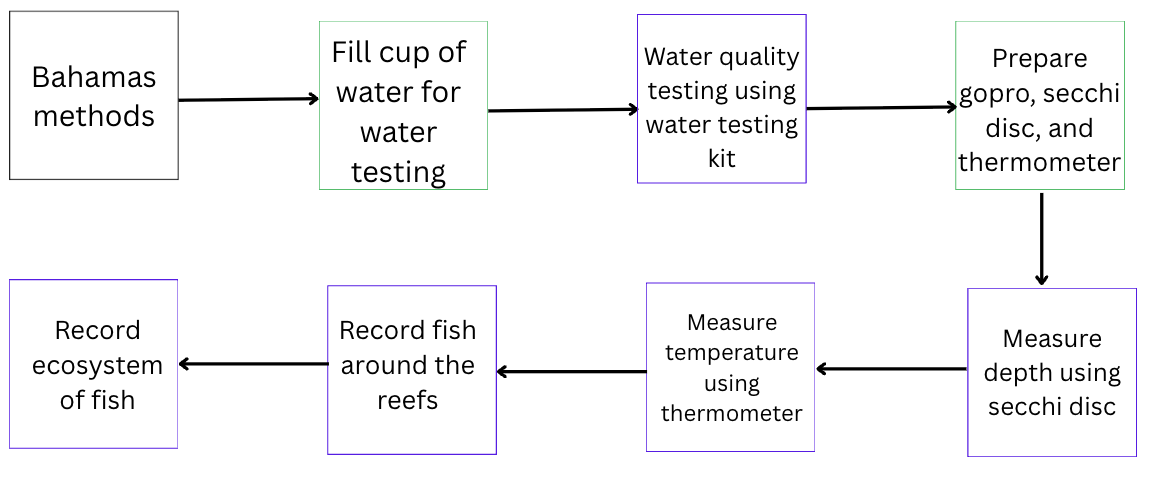
Figure 1: Flowchart of our data collection in the Bahamas. The purple box outline represents when we are collecting data, and the green box outline represents when we prepare materials for testing/collecting data.
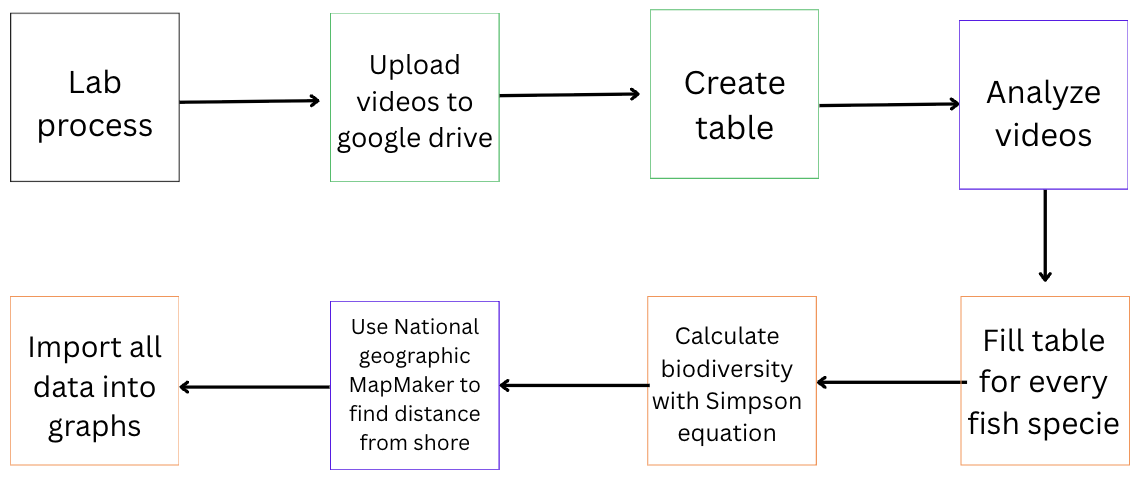
Figure 2: Flowchart of tasks done at Browning. The green box outline represents organization tasks, the purple box outline represents collecting data, and the orange box outline represents working with tables.
Figure
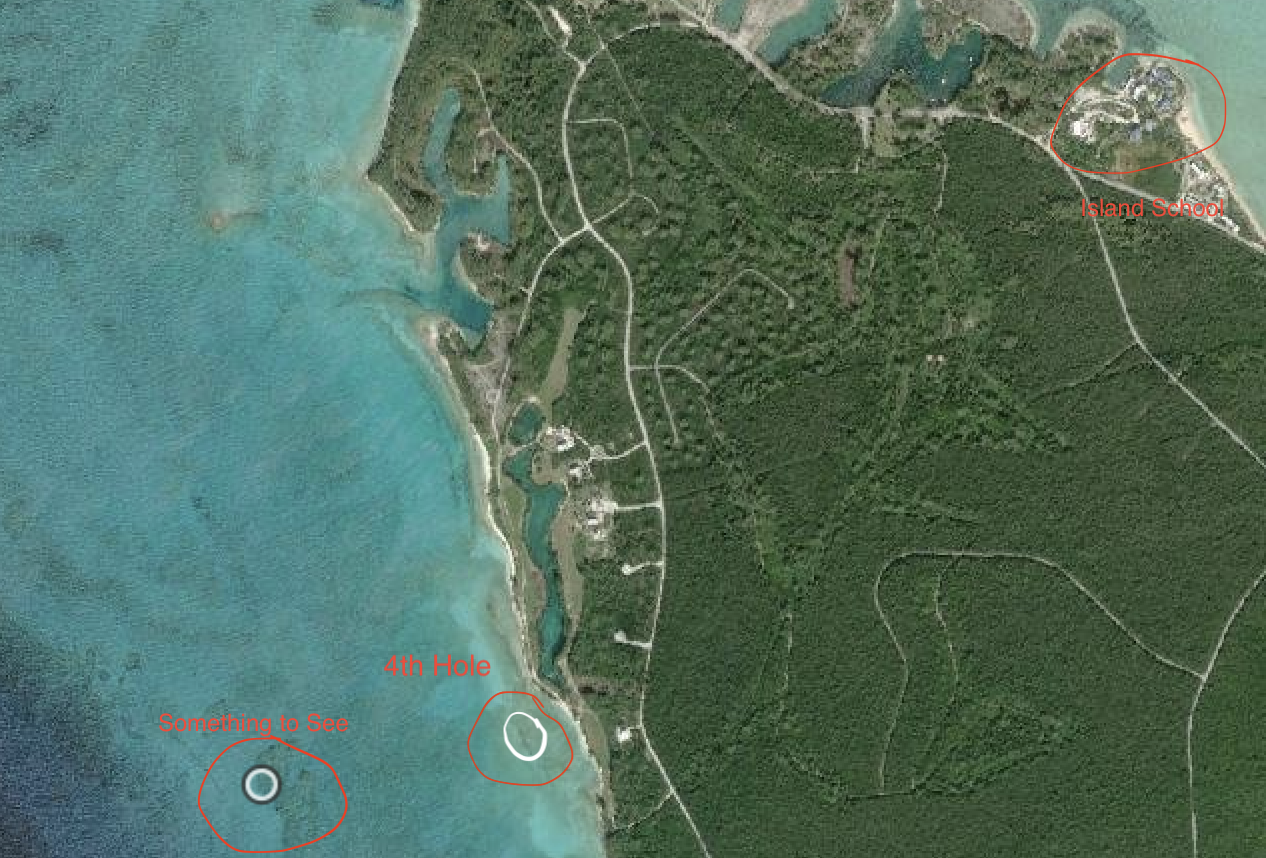
Figure 3: Map of the 4th hole, Something to See, and the Island School: This GIS map highlights the Island School, located in Eleuthera, Bahamas, the “4th hole” coral reef, and “Something to See” coral Reef.
Location | Fish species | Number of fish |
4th Hole | Parrot fish | 12 |
Juvenile striped goby | 38 | |
Spotted drum | 1 | |
Sergeant major | 1 | |
Yellowtail snappers | 87 | |
total | 139 | |
Something to See | Bluehead Wrasses | 84 |
Juvenile Yellowtail Damselfish | 16 | |
Great Barracuda | 1 | |
Sergeant Majors | 27 | |
Blue Chromis | 7 | |
Parrot Fish | 1 | |
Unknown | 7 | |
total | 143 |
Table 1: The different types of fish species in the 4th hole and Something to see reefs. The number of fish species in the two sites and the total number for each site.
Location | Fish species | Biodiversity |
4th Hole | Parrot fish | 0.00753 |
Juvenile striped goby | 0.07474 | |
Spotted drum | 0.00005 | |
Sergeant major | 0.00005 | |
Yellowtail snappers | 0.39175 | |
Biodiversity index | 0.47412 | |
Total Biodiversity | 0.52588 | |
Something to See | Bluehead Wrasses | 0.34505 |
Juvenile Yellowtail Damselfish | 0.01252 | |
Great Barracuda | 0.00005 | |
Sergeant Majors | 0.03565 | |
Blue Chromis | 0.00240 | |
Parrot Fish | 0.00005 | |
Unknown | 0.00240 | |
Biodiversity index | 0.39812 | |
Total Biodiversity | 0.60188 |
Table 2: The biodiversity index for the two sites: 4th hole and Something to see reefs. The biodiversity index and the total biodiversity for each location.
Location | Salinity (ₚₚₜ) | pH | NO^3 (ₘ₉/ₗ) | NO^2 (ₘ₉/ₗ) | Dissolved O₂ PPM (ₘ₉/ₗ) | Temperature (°C) | Depth (ₘ) | Distance from shore (ₘ) |
4th Hole | 38.6 | 8 | 0 | 0 | 7 | 28 | 1.63 | 119.49 |
Something to See | 37.7 | 8 | 0 | 0 | 5 | 25 | 21.77 | 709.78 |
Table 3: The water quality properties of the sites from the shore of the two sites. The measurements of water quality consist of: salinity, pH, NO₃, NO₂, dissolved O₂, and temperature, along with this also the depth of locations and distance from shore.
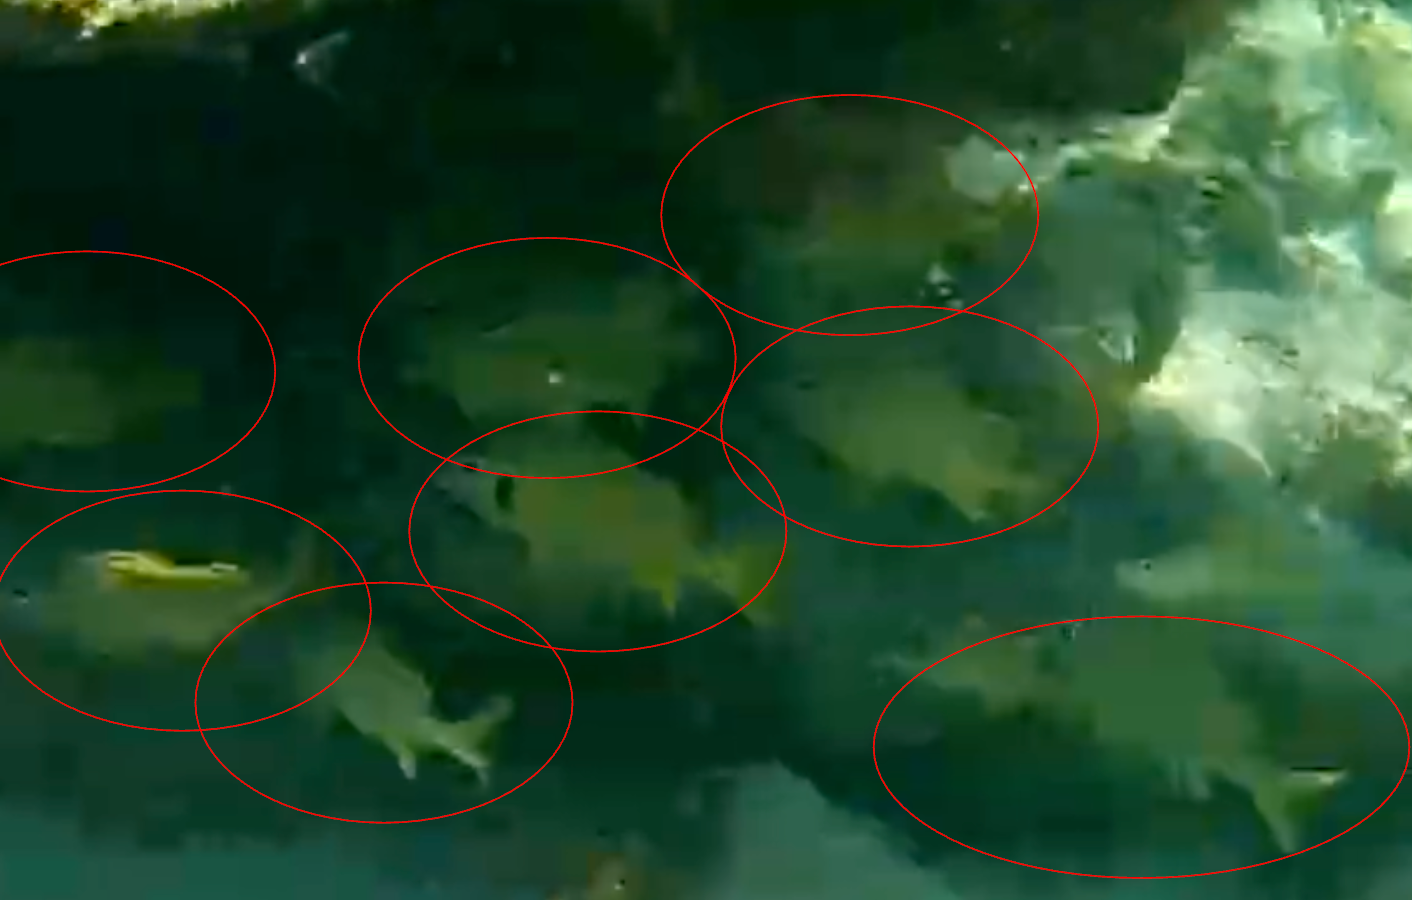
Figure 4: A group of Yellowtail snappers swimming (Site 1)
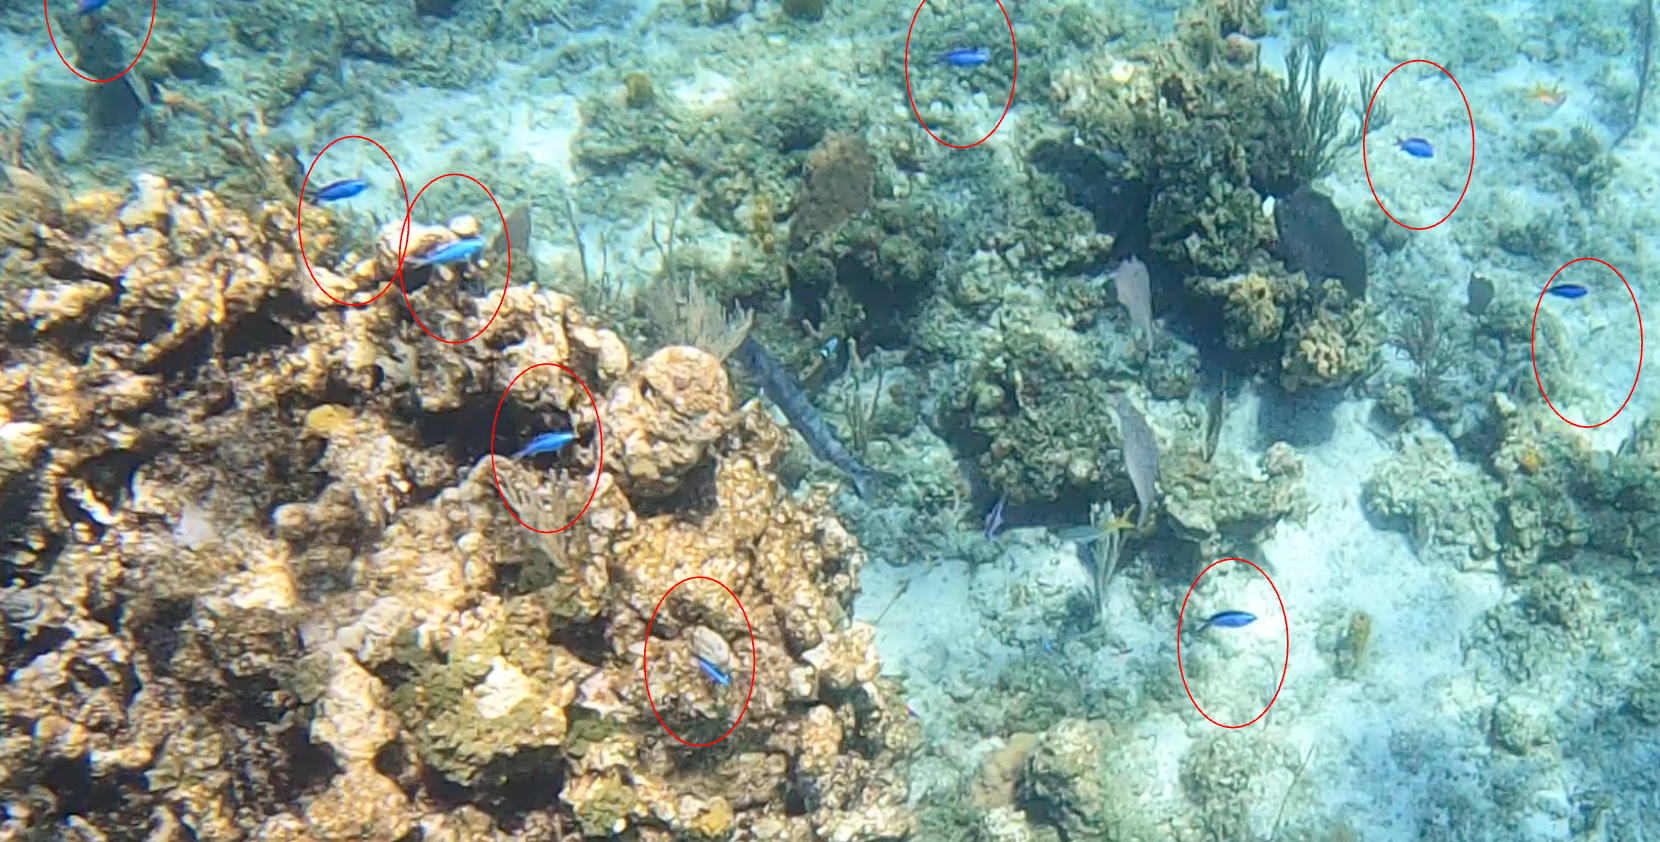
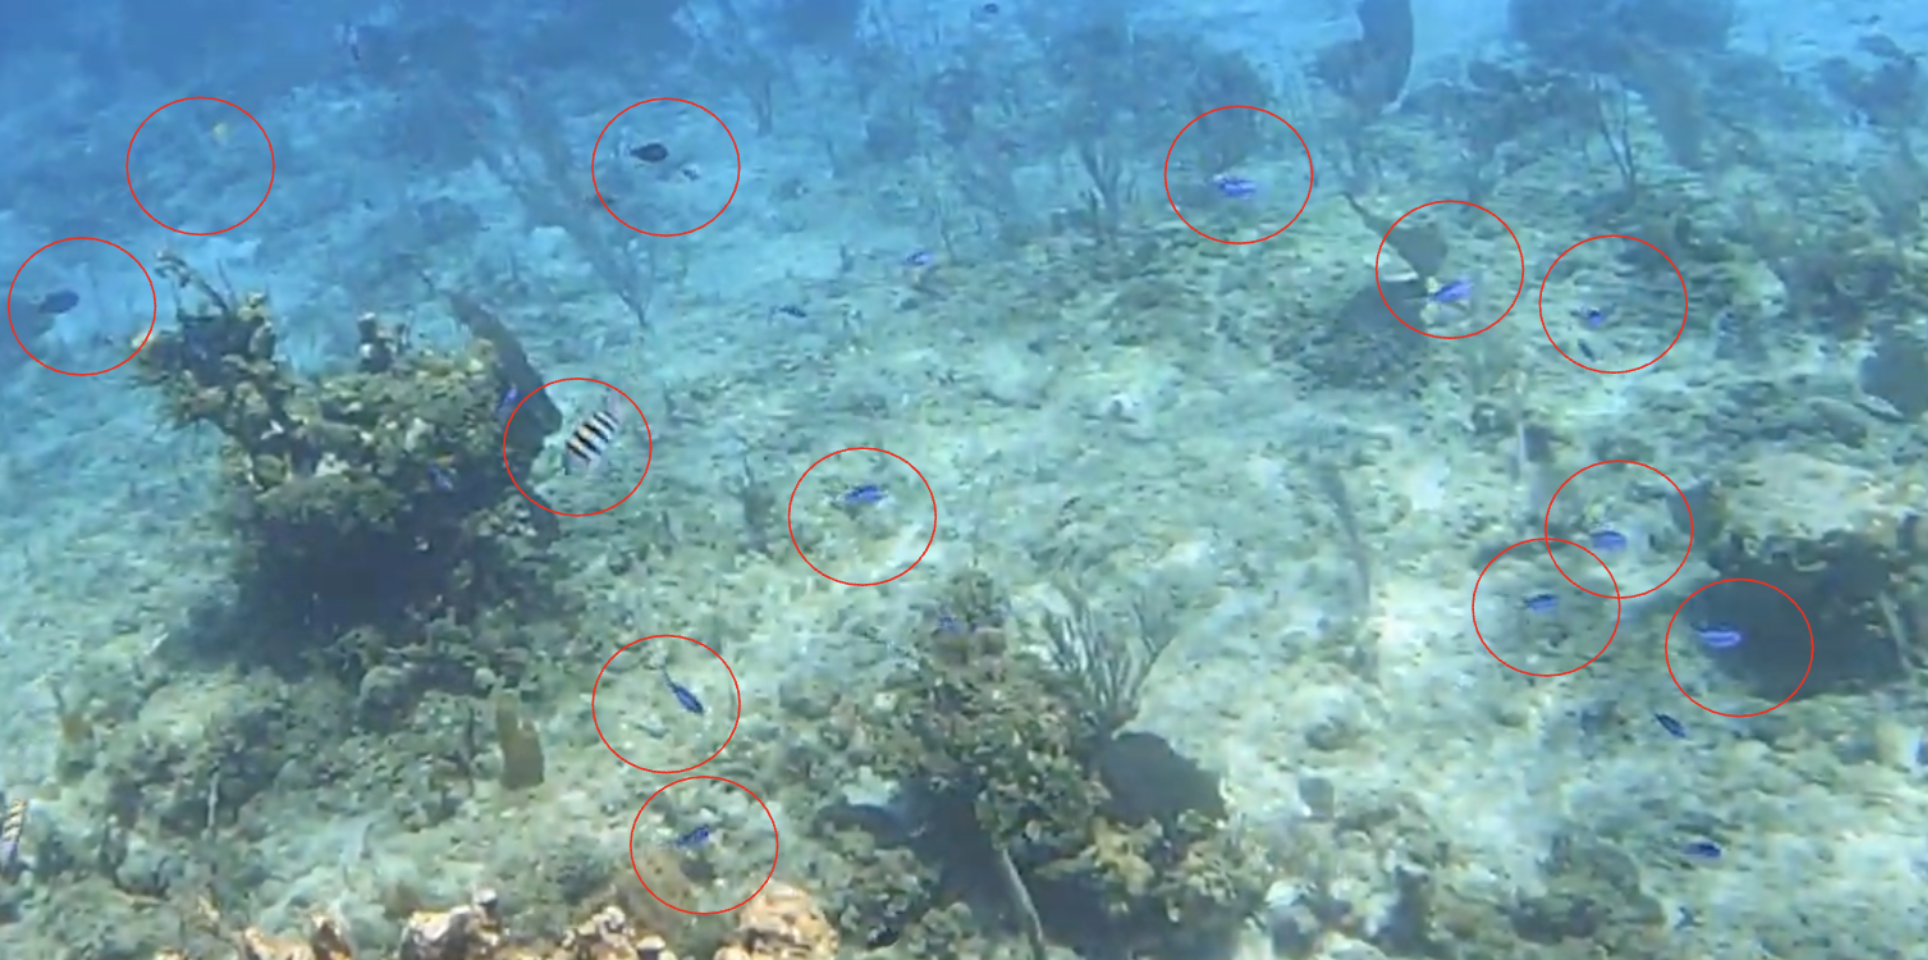
Figure 5: A group of bluehead wrasses swimming in Site 2, “Something to See”.
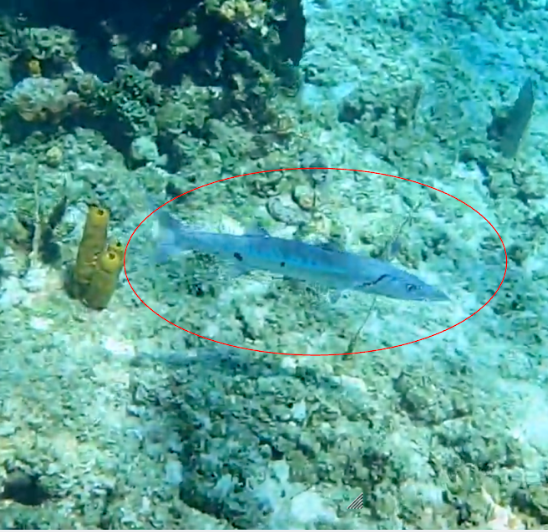
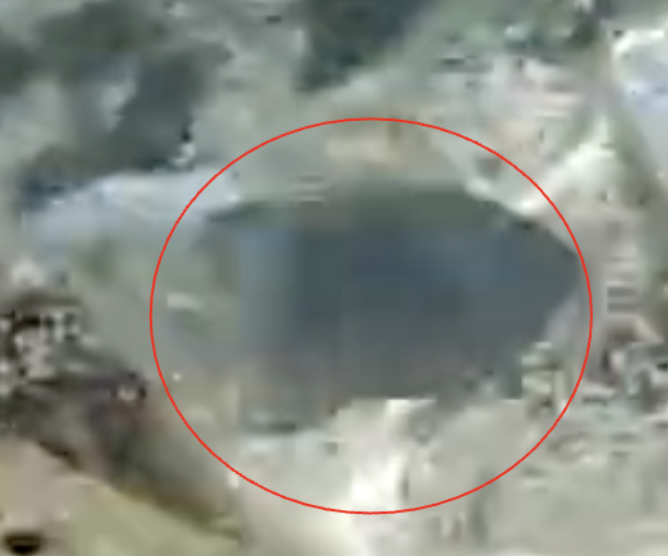
Figure 6: A great barracuda in site 2.
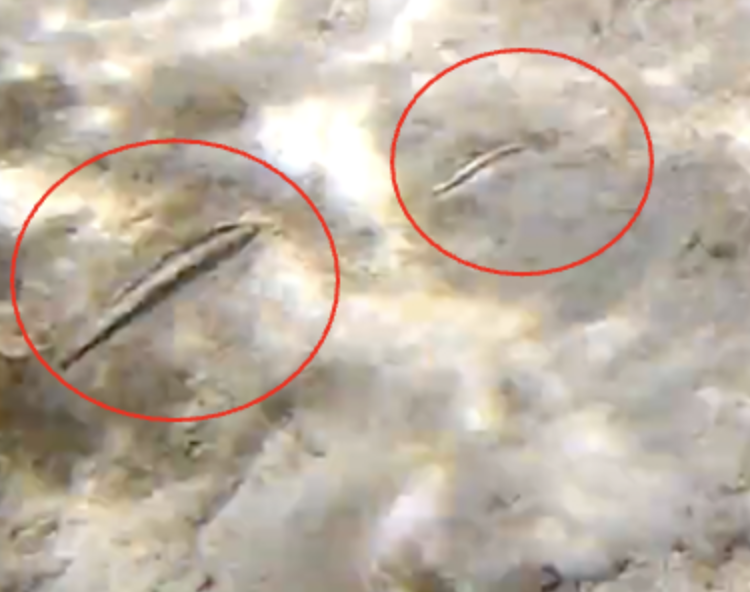
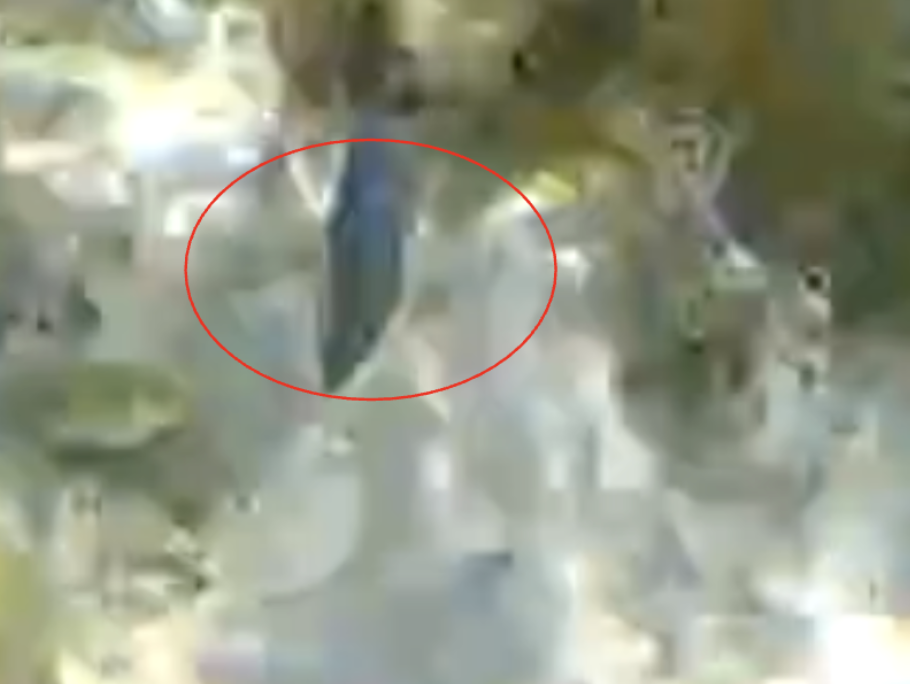
Figure 7: Juvenile striped goby in site 1.
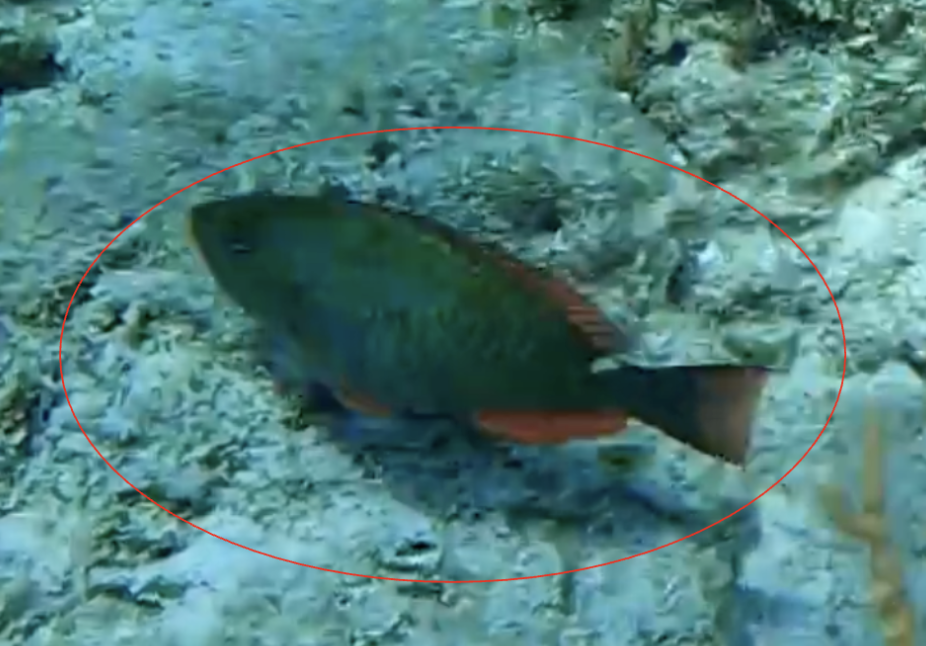
Figure 8: Parrot fish in site 2.
Figure 9: Parrot fish in site 1.
Figure 10: Sergeant major in site 1.
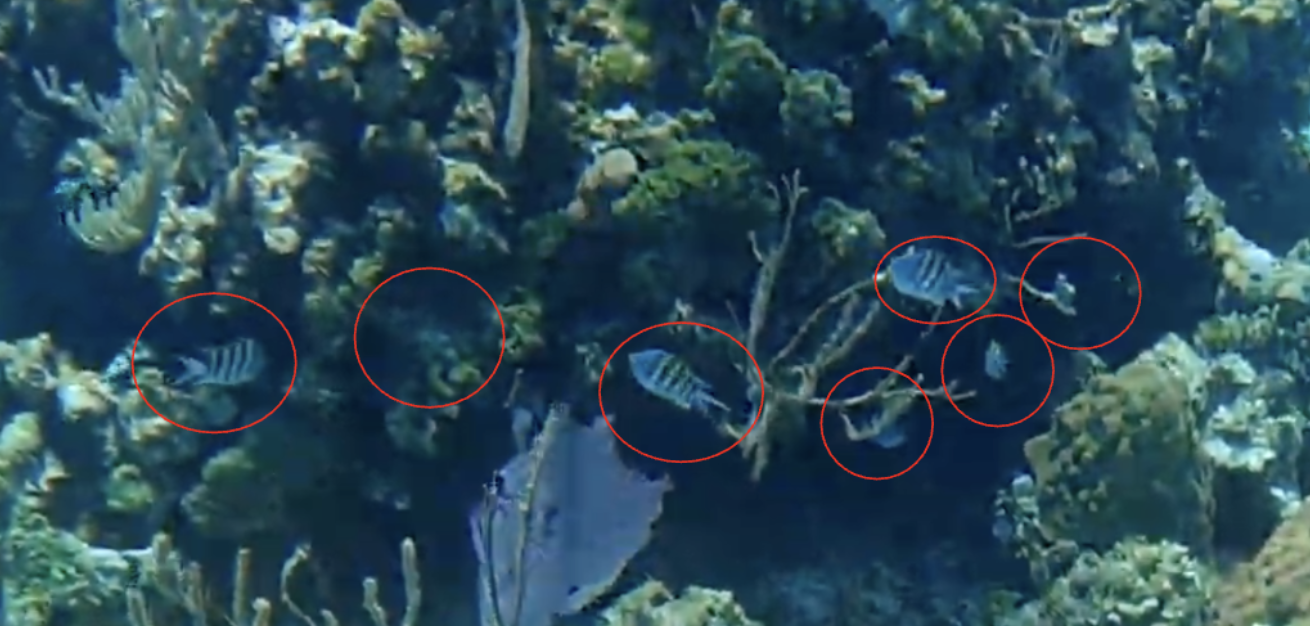
Figure 11: Sergeant major in site 2.
Figure 12: A mix of sergeant major and bluehead wrasses in site 2.
Figure 13: Yellow tail snappers in site 1.
A.)B.)
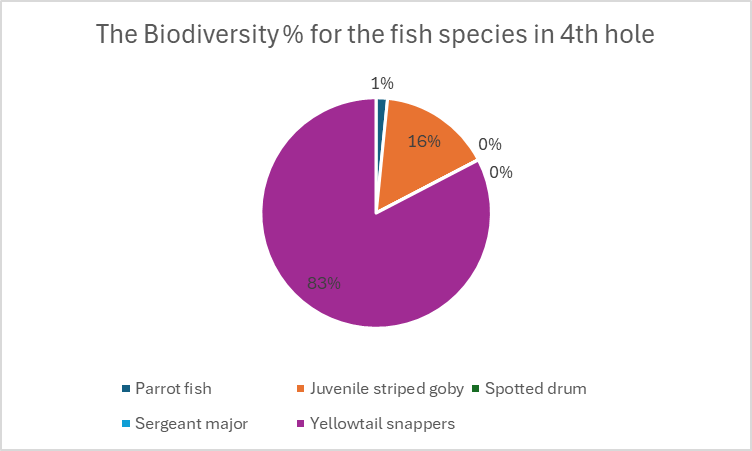
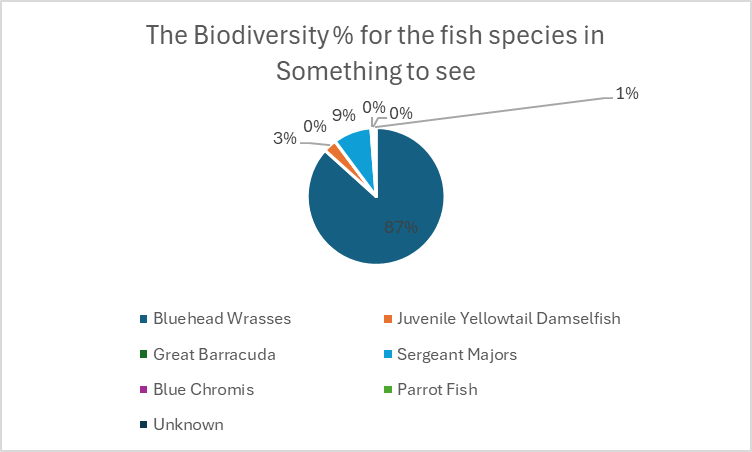
Figure 14: A.) The Biodiversity % for the fish species in the 4th hole. B.) The biodiversity % for the fish species in Something to see. A.) The percentages of the different fish species found. B.) The percentages of the different fish species found.
A.)B.)
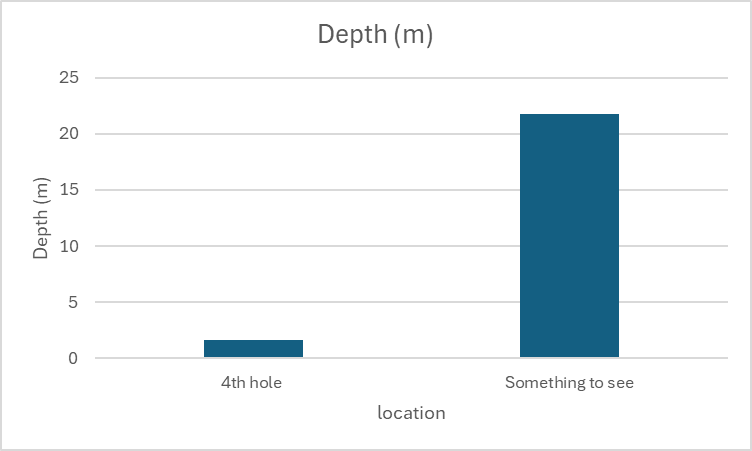
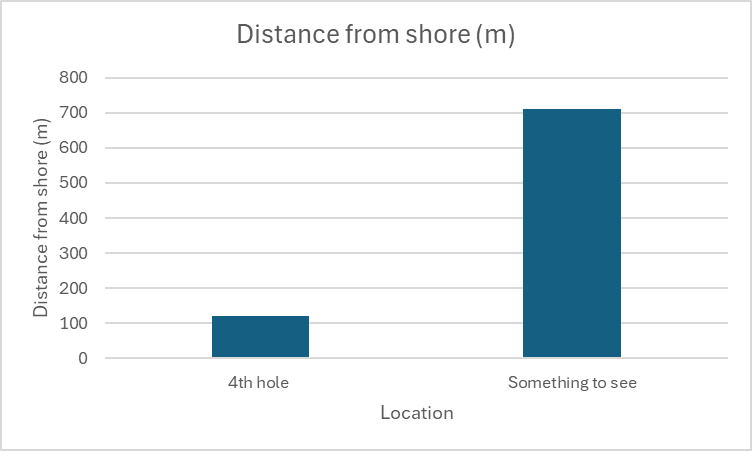
Figure 15: The Distance and Depth differences between the 4th hole and Something to See. A.) The difference in depth. B.) Difference in distance from shore.
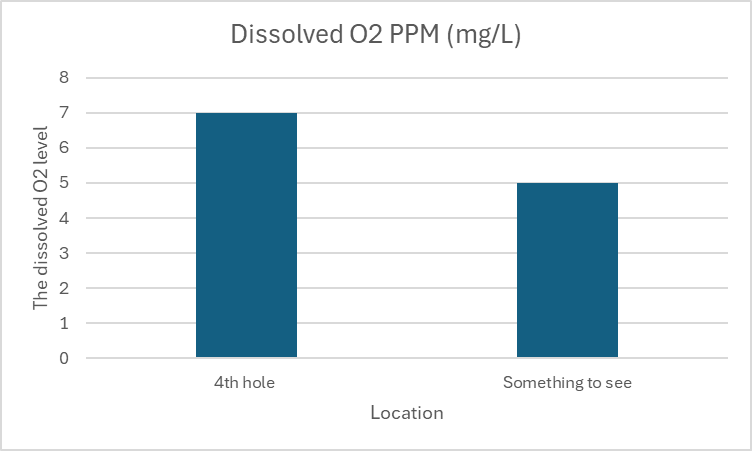
Figure 16: The Dissolved O₂ difference between the 4th hole and Something to See.
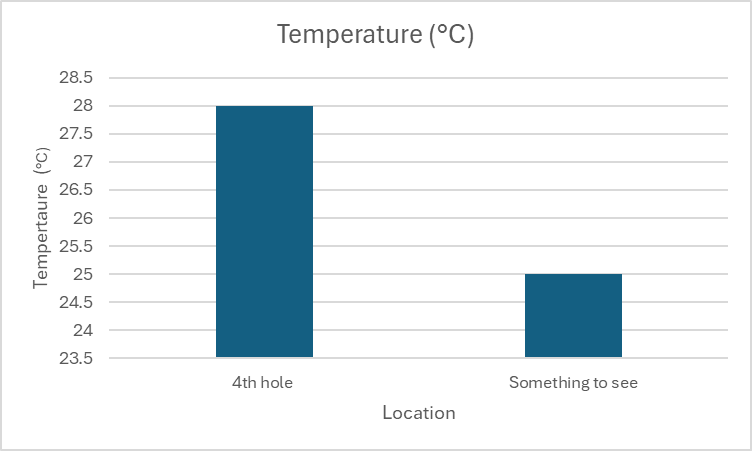
Figure 17: The temperature difference between the 4th hole and Something to See.
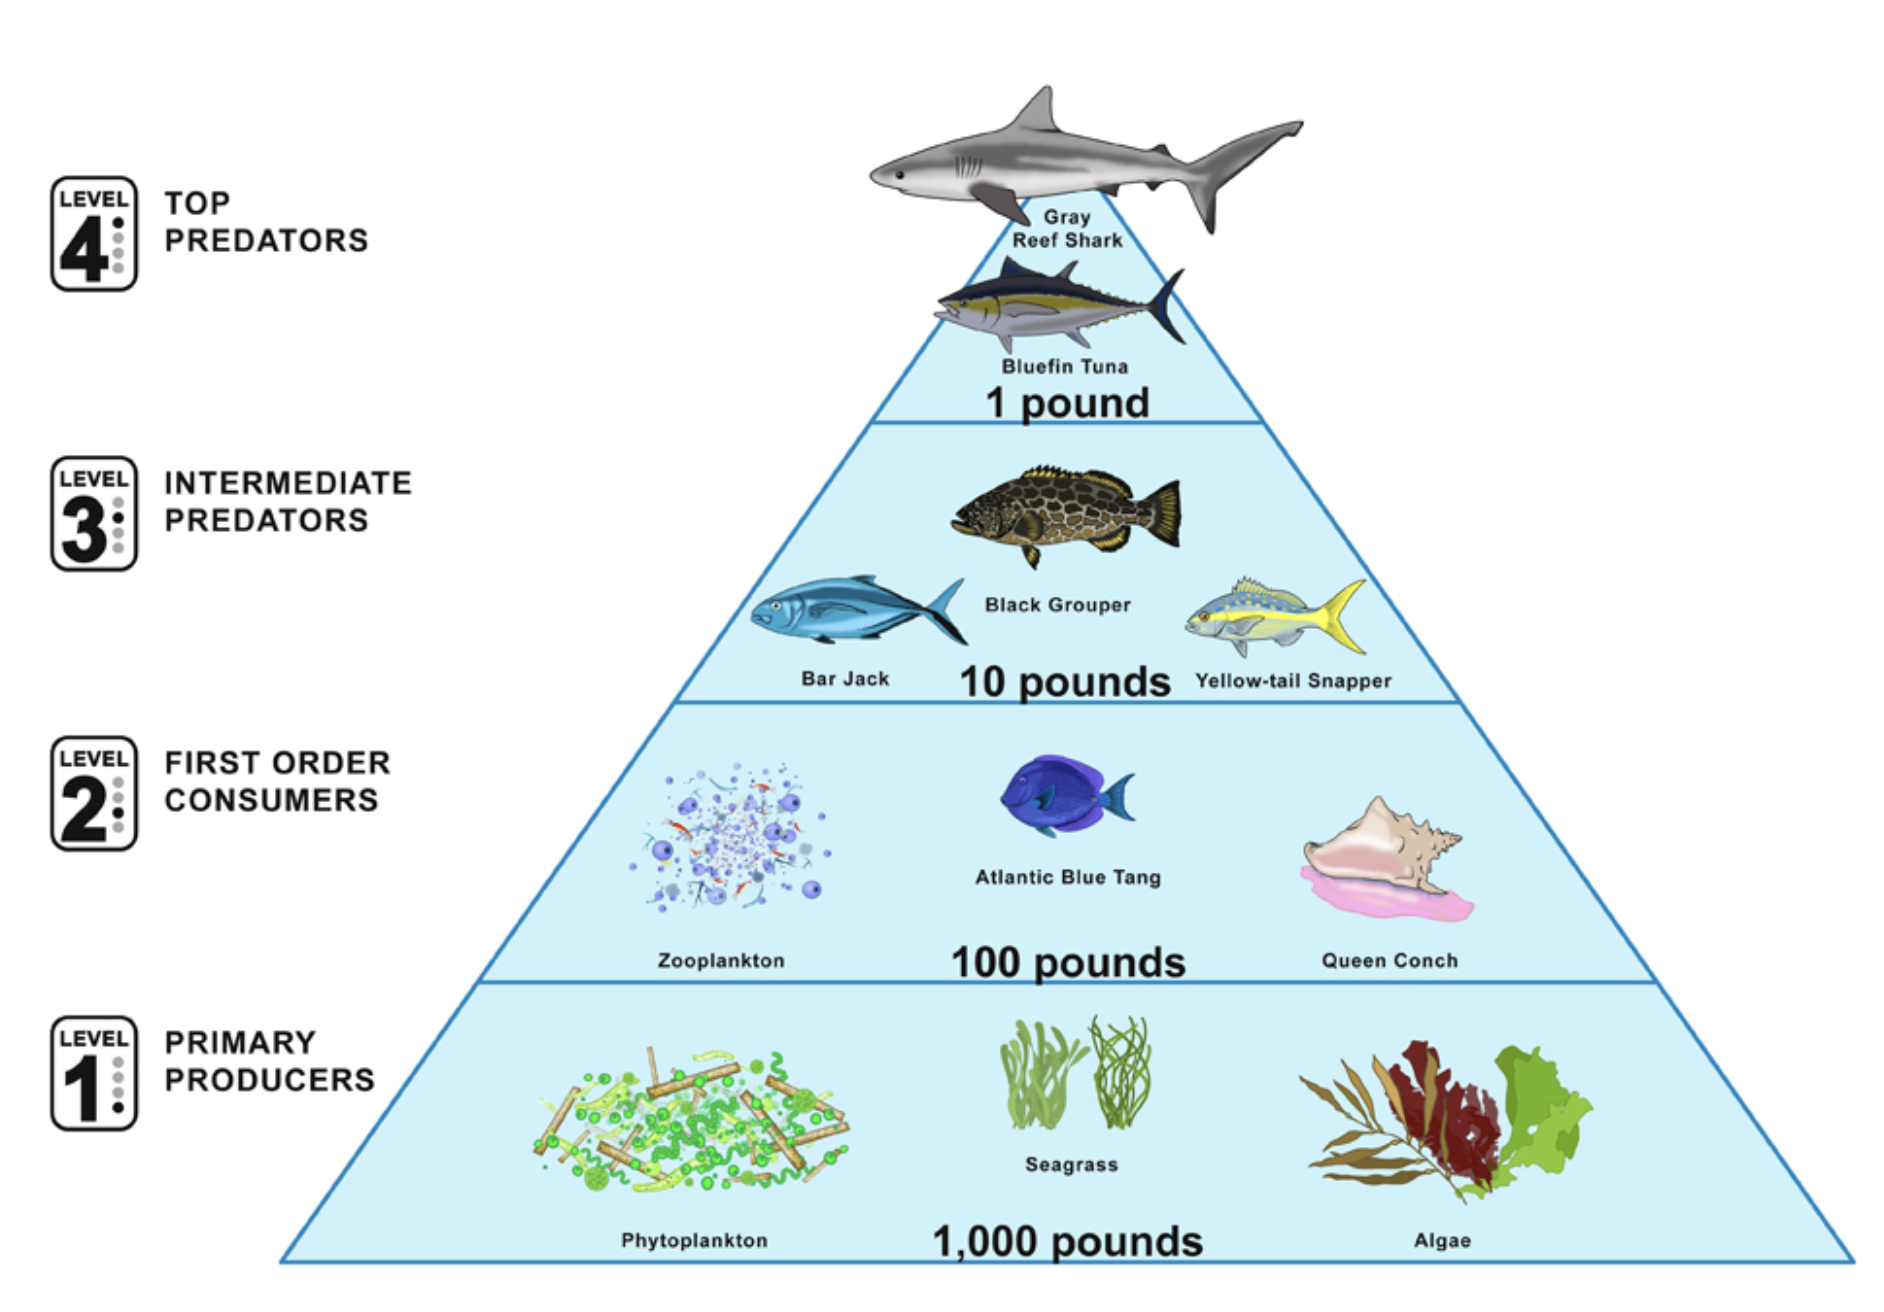
Figure 18: Marine Food Pyramid: The food pyramid in the Bahamas. (National Geographic)
Result
The comparative analysis of the two marine sites, 4th Hole and Something to See, reveals significant differences in species composition, biodiversity, and environmental conditions. These variations provide insight into how physical and chemical parameters influence marine biodiversity.
A total of 139 individual fish were observed at the 4th Hole, with Yellowtail Snappers (87 individuals) and Juvenile Striped Gobies (38 individuals) being the most dominant species. In contrast, Something to See had a slightly higher total count of 143 individuals, largely due to the high number of Bluehead Wrasses (84 individuals) and a moderate number of Sergeant Majors (27 individuals). (Table 1)
Despite having fewer species, Something to See exhibited a higher biodiversity index (0.60188) compared to the 4th Hole (0.52588). (Table 2) The higher biodiversity index at Something to See indicates a more ecologically balanced habitat with reduced dominance by a single species across different species. (Table 2) Environmental factors varied significantly between the two sites. The 4th Hole, which is closer to shore (119.49 m) and shallower (1.63 m), had higher salinity (38.6 ppt), higher dissolved oxygen (7 mg/L), and a warmer temperature (28°C). (Table 3) These conditions are conducive to supporting species like Yellowtail Snappers and Juvenile Gobies, which prefer shallow, oxygen-rich environments. (Figure 3)
In contrast, Something to See is located much farther from shore (709.78 m) and at a significantly greater depth (21.77 m). It had lower dissolved oxygen levels (4 mg/L) and a cooler temperature (25°C).
Discussion
Based on the analysis of species abundance and environmental conditions at the two marine survey sites, 4th Hole and Something to See, it can be inferred that habitat depth, temperature, and dissolved oxygen levels significantly influence fish biodiversity and community structure. The 4th Hole, a shallow, nearshore site with warmer water and higher dissolved oxygen, supported a high abundance of a few dominant species, indicating low species evenness and a lower biodiversity index. (Tables 2 and 3) In contrast, Something to See, a deeper, offshore site with cooler water and lower oxygen levels, hosted a more even species distribution, leading to a higher biodiversity index despite lower species abundance in some cases. (Tables 2 & 3)
One of the most notable environmental differences between the two sites was the dissolved oxygen (DO) level. 4th Hole, the nearshore site, had a DO₂ level of 7 mg/L, while Something to See, farther offshore, had a lower DO₂ level of 5 mg/L. (Table 3) This result was surprising, as we initially hypothesized that higher DO₂ would lead to greater fish biodiversity. However, Something to See, with lower DO₂, showed a higher biodiversity index. This challenges our hypothesis and suggests that DO₂ is not the only—or even the dominant—factor shaping biodiversity at these reef sites. (Table 3) (U.S. Environmental Protection Agency.)
Instead, depth, temperature, and distance from shore may play larger roles. Something to See was significantly deeper (21.77 m vs. 1.63 m) and cooler (25 °C vs. 28°C), and it was farther from shore (709.78 m vs. 119.49 m). (Tables 2 & 3) These conditions likely create a more stable, less disturbed environment, which may help support a broader range of fish species. The greater depth and distance from shore may reduce the impact of human activity, sedimentation, and temperature fluctuations, making the offshore reef a more favorable habitat for diverse marine life. These environmental conditions may limit some species but also create niches suitable for others, contributing to their higher biodiversity index. The presence of deeper-water species like the Great Barracuda and Bluehead Wrasses supports this inference. (Figures 4 & 5)
Additionally, the species distribution supports this idea. At the 4th Hole, Yellowtail Snappers dominated the population, making up over 60% of all fish counted. (Table 2, Figure 3) This high dominance decreased the site's overall biodiversity index. In contrast, Something to See had a more even spread of species, including a large number of Bluehead Wrasses and moderate numbers of Sergeant Majors and other species. This evenness is a key factor in increasing the biodiversity index and suggests that fish species are surviving and thriving, and coexisting in more balanced numbers offshore.
Although DO₂ is essential for fish respiration and survival, it may be that other abiotic factors—especially temperature, depth, and habitat complexity—can compensate for slightly lower oxygen levels. Deeper, cooler water may also hold more stable oxygen levels over time, even if the snapshot measurements show lower concentrations. Moreover, some reef fish are adapted to cope with varying oxygen conditions, especially if they live in more complex habitats where they can hide from predators and find food more easily.
Our findings demonstrate that fish biodiversity is influenced by a combination of abiotic factors, not just dissolved oxygen. While DO₂ remains a critical factor, especially in more extreme or polluted environments, coral reef ecosystems are shaped by a network of interacting conditions. These results highlight the importance of preserving a range of reef habitats, from shallow to deep, nearshore to offshore, to support a full spectrum of marine life.
There are some steps along the way that could have induced errors in our data. One, although unlikely, is equipment malfunction. This could cause incorrect numbers in our data or prevent us from getting data. One example is when we were recording fish in site 2, our GoPro was not working, and it could have ended disastrously had the other group and Mr. Wong not so kindly shared their videos with us. Another widespread cause is simple human error. Whether it's writing down the wrong number or counting the fish wrong/double-counting, human error causes many discrepancies in the data that could lead us to incorrect conclusions.
To solve these problems, some simple fixes were implemented to help keep our data correct. For equipment, we took multiple readings of the same site for water quality, especially temperature, to ensure we got the correct numbers. Unfortunately, there is no simple remedy for human error, but we made sure to double-check each other's work, significantly reducing the chance of error.
These findings suggest that offshore and deeper marine environments provide more stable or varied niches, supporting greater biodiversity. (Hensel, Enie, Jacob E. Allgeier, and Craig A. Layman.) In contrast, environments closer to land favor species adapted to warmer, oxygen-rich conditions, which can result in species dominance. Therefore, environmental gradients such as depth, temperature, and oxygen availability play a pivotal role in shaping marine biodiversity in coastal reef systems. Some future research questions that we would like to explore are: How do varying dissolved oxygen levels affect the species richness (Quantity) and abundance of fish in coral reef ecosystems, and what are the main environmental factors that influence dissolved oxygen levels in nearshore versus offshore reef zones.
Acknowledgements
We, the Fish A of 2025, would like to thank Mr. Wong for being such a helpful mentor during this project. We appreciate every moment that we were with him, whether it was untangling the tape measure from the coral or helping fix the GoPro camera. We appreciate his wisdom, funny science jokes, and fun time during the run-swim. We also would like to thank the Browning staff for allowing the trip to run smoothly. Without them, the trip would not be the same. We would also like to thank all of the Island School staff. From the general staff to the kitchen staff, the trip would have been a whole different experience. Thank you, all of the general staff, for pushing through our limits and guiding us through the day. Thank you to the Kitchen Staff for preparing our food. Over the trip, we have learnt so much, but mainly to value everything. Due to the lack of water, we had to be grateful for even the tiniest drop of water. We also learnt that working together is more important than individuality when having a large workload and a project like this. Collecting data with each other was super fun, but we also learned that work comes before fun.
Reference
1.) American Museum of Natural History. Salinity Variations in Sea Water in the Vicinity of Bimini, Bahamas, British West Indies. American Museum Novitates, no. 1822, 1957, https://digitallibrary.amnh.org/items/87ca4492-d4d3-44ea-b5af-716de4054bc4. Accessed 11 Apr. 2025,
2.) Araújo, Marcelo S., et al. “Ecosystem Fragmentation Drives Increased Diet Variation in an Endemic Livebearing Fish of the Bahamas.” Ecology and Evolution, vol. 4, no. 16, Aug. 2014, pp. 3298–3308. Wiley Online Library, https://doi.org/10.1002/ece3.1140. Accessed 26 May 2025.
3.) Greshko, Michael. “Fish Urine Is Key to Coral Reef Health.” National Geographic, 19 Aug. 2016, https://www.nationalgeographic.com/science/article/fish-urine-pee-coral-reefs-recycling-nutrients-ecology. Accessed 13 Apr. 2025.
4.) Hensel, Enie, Jacob E. Allgeier, and Craig A. Layman. "Effects of Predator Presence and Habitat Complexity on Reef Fish Communities in The Bahamas." Marine Biology, 2019, n. pag.
5. National Geographic Society. "Marine Food Pyramid." National Geographic Education, https://education.nationalgeographic.org/resource/marine-food-pyramid-1/. Accessed 25 May 2025.
6.) Nazarova, Arai. "Unveiling Deep-Sea Fish Relationships: Analysis of Existing Data Reveals Potential Commensalism." NHSJS Reports, 22 May 2024.
7. NOAA. "Do Fish Sleep?" National Ocean Service, National Oceanic and Atmospheric Administration, 16 June 2024, https://oceanservice.noaa.gov/facts/fish-sleep.html.
8. NOAA Atlantic Oceanographic and Meteorological Laboratory. “News.” NOAA AOML, www.aoml.noaa.gov/news/. Accessed 13 Apr. 2025.
9. NOAA Fisheries. "A Better Chance for Resilience: Using Hungry Fish to Conserve Coral Reefs." NOAA Fisheries, 17 Apr. 2022, https://www.fisheries.noaa.gov/feature-story/better-chance-resilience-using-hungry-fish-conserve-coral-reefs.
10.) NOAA Ocean Explorer. “Bahamas Deep-Sea Corals Exploration 2009.” NOAA Ocean Exploration, 13 Mar. 2009, https://oceanexplorer.noaa.gov/explorations/09deepseacorals/welcome.html. Accessed 13 Apr. 2025.
11.) Rolling Harbour Abaco. Bahamas Reef Fish Index. Rolling Harbour Abaco, 2025, https://rollingharbour.com/marine-life-2/bahamas-reef-fish-index/. Accessed 11 Apr. 2025.
12.) “Salinity.” Aquapedia, Water Education Foundation, 7 Sept. 2016, www.watereducation.org/aquapedia-background/salinity. Accessed 26 May 2025.
13.) Science Learning Hub. Ocean Salinity. The University of Waikato, 22 June 2010, https://www.sciencelearn.org.nz/resources/686-ocean-salinity. Accessed 11 Apr. 2025.
14.) Smith, Charlie. “This Man Is Living Your Tropical Island Dream Life.” National Geographic, 5 Apr. 2016, www.nationalgeographic.com/adventure/article/this-man-is-living-your-tropical-island-dream-life. Accessed 13 Apr. 2025.
15.) The Nature Conservancy. Sustainable Fisheries in The Bahamas. The Nature Conservancy, 2025, https://www.nature.org/en-us/about-us/where-we-work/caribbean/bahamas/stories-in-the-bahamas/sustainable-fisheries/. Accessed 10 Apr. 2025.
16.) U.S. Environmental Protection Agency. "Dissolved Oxygen." Causal Analysis/Diagnosis Decision Information System (CADDIS), 24 Oct. 2024, https://www.epa.gov/caddis/dissolved-oxygen.
17.) Wang, Hansen. "Micro Plastic Effects on FreshWater Fish—Take Micro Plastic Polypropylene’s Effects on Medaka Fish as an Example." National High School Journal of Science, 29 June 2024.
18.) Hensel, Enie, Jacob E. Allgeier, and Craig A. Layman. “Effects of Predator Presence and Habitat Complexity on Reef Fish Communities in The Bahamas.” Marine Biology, vol. 166, no. 10, Oct. 2019, p. 136, Springer Berlin Heidelberg. https://search.nal.usda.gov/discovery/fulldisplay?docid=alma9916090377307426
19.) Fischetti, Connor J., and Emilie D. Wolf. "Observing How the Distance from the Mouth of a Bahamian Mangrove Affects Biodiversity." Journal of Emerging Investigators, 8 Feb. 2021, https://doi.org/10.59720/19-082.
20.) Sheppard, Alyson. "In the Bahamas, Invasive Fish May Become Dinner to Restore Ecosystem." National Geographic, 10 Aug. 2009, www.nationalgeographic.com/adventure/article/in-the-bahamas-invasive-fish-may-become-dinner-to-restore-ecosystem.
21.) "Biochemical Oxygen Demand." Science.gov, U.S. Department of Energy Office of Scientific and Technical Information, https://www.science.gov/topicpages/b/biochemical+oxygen+demand. Accessed 2 June 2025.
Link to our Bibliography